We’ve added two new charts to the Stats page. Now you can see which of your shop sections are performing the best so you can work on the ones that aren’t doing as well and you can see the ratio of new and returning customers to your shop. You can use this new data to get more insight into your shop so you can make better decisions and sell more templates.
Top Shop Sections Pie Chart
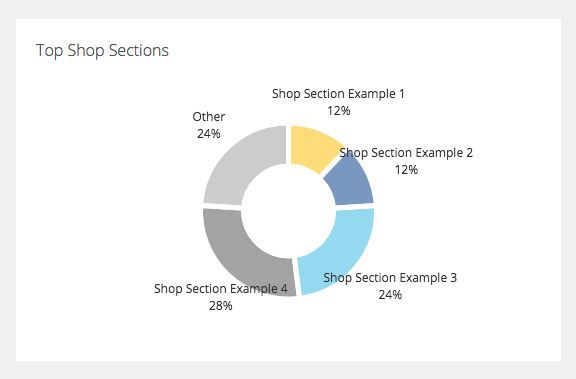
In this pie chart, we’ll show you your top shop sections for the chosen date range. Any shop sections less than 10% will be put in the Other category to keep the chart data looking clean and manageable.
New / Returning Customers Pie Chart
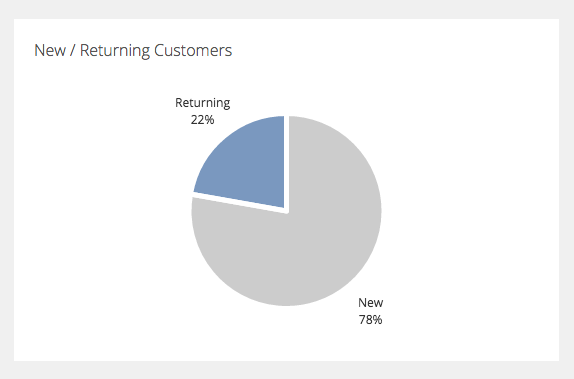
This chart shows you the ratio of new and returning customers to your shop in a chosen date range. Research shows that repeat customers have a 60-70% chance of converting. This makes repeat customers so much more profitable than new customers.
We hope with this new data you’ll be able to make better decisions about your shop and it will help you sell more templates.